Archive for the ‘Uncategorized’ Category

SMUphole3

Saturday, January 9th, 2021

As a change from the scamdemic, some new software.

SMUH3 is now ready.

Upholes are often neglected these days. The powers that be seem to think fancy processing can compensate for not having a reliable near surface model.

Some companies still include upholes in their programs though, and we need a way to QC the results.

SMHU3 offers more than just QC though, it optionally encapsulates the data, the results and additional documents into a single file so that all information is available at a future date.

It is easy to use and quite configurable, so you get the displays you want rather than what someone else has decided looks good.

Details here:

https://seismatters.com/SMUH3.html


When the cameras are off

Sunday, November 1st, 2020

The US top Covid expert, one Dr. Fauci continues to go on about THE VIRUS and how deadly and infectious it is.
He is also a leading exponent of masks. Or is he?
It seems only when the cameras are on him.
When he thinks they are off, his beliefs seem to change.

Here he is in the midst of a world changing ‘Pandemic’ playing rounders

And here he is after some sort of government meeting. The full video here:

Could it be that we have been lied to?
Surely not.

The Scamdemic – Some figures

Wednesday, October 21st, 2020

Let’s consider a population of 1,000,000 infected individuals.

Based on published official figures:

45% will have no symptoms (550,000 remaining)

85% of the remainder recover with no special treatment (82,500 Remaining)

95% of those left requiring treatment recover (4125 Remaining)

90% of those deaths are due to underlying causes, not Covid (413 Covid deaths)


So a total of 413 out of 1,000,000 might die of covid-19. That is a 1 in 2400 chance.

And that is if you become infected, because around 20% of the population is already immune!


From this site:

https://www.nsc.org/work-safety/tools-resources/injury-facts/chart

We see the odds of dying by various causes (these are US statistics from 2018)

It is interesting to note that in the US, you have a 1 in 370 chance of being killed in a firearm assault, and a 1 in 7 chance of dying from heart disease or cancer.

Apart from firearm deaths, figures elsewhere in the world seem fairly similar.

So why are we in a panic over a disease that has a 1 in 2400 chance of getting us and will have largely burnt out in a few more months like every seasonal flu?


An interesting statistic from National geographic:

https://www.nationalgeographic.com/news/2005/6/flash-facts-about-lightning/

I find this a bit hard to believe, other sites put the odds at between 1 in 15,000 to 1 in 50,000 over a lifetime, but if true, we have a similar chance of being hit by lightning than dying of covid-19!

We really have entered the Twilight zone.

The true victims of the scamdemic

Sunday, October 4th, 2020

So Mr. Trump has the virus now.

Call me cynical if you want, but the timing is quite convenient.

No more embarrassing interviews or debates, all the while demonstrating solidarity with the common man.

Very reminiscent of what went on in the UK a few months ago, which was followed by an amazing recovery from such a deadly and horrific disease.

A disease that is so horrific and deadly that 45% of people who have it, don’t even know:

https://news.yahoo.com/cnns-dr-sanjay-gupta-puts-114445685.html

 ABC News chief medical correspondent Dr. Jennifer Ashton said Trump will likely avoid the worst

but not get off scot free: “About 80 percent of people infected with COVID-19 do not require hospitalization. That doesn’t mean, though, that their disease course will be mild. It just means that they can be managed in a home environment.

And we also know that 45 percent of those infected — up to 45 percent — will show no symptoms.”


The true victims of this scamdemic are those that cannot get treatment due to the lockdowns, those who have lost their livelihoods, and those (like me) who can’t even get home.

In this article, which I have referred to in earlier posts:

https://news.yahoo.com/almost-one-third-covid-deaths-155426293.html

We have this interesting quote:

“In the lockdown, there may have been even more deaths that were not caused by Covid,

but were caused by the actions of lockdown – and that is important to know,” added Dr Oke.


In the UK alone, a study suggests that 18000 more cancer deaths due to the lockdown.

https://uk.news.yahoo.com/coronavirus-epidemic-could-lead-18-000-more-cancer-033800748.html


And an older article from Australia, suicides due to the lockdowns are expected to exceed the covid deaths:

The rise in the suicide rate caused by lockdowns in Australia is predicted to exceed deaths from the Wuhan coronavirus by a factor of ten, the Australian reported Thursday.

https://www.breitbart.com/health/2020/05/07/report-suicide-rise-from-lockdowns-to-kill-more-than-coronavirus-in-australia/


So the world is in disarray due to a virus that is so nasty 45% of people don’t know even know they have had it, where 80% of those that do show symptoms need no special care, where 9 out of 10 deaths are due to underlying causes.

And where infections and deaths are exaggerated to promote a false picture of doom.

Let’s be honest and get back to normal – it’s the seasonal flu. Nothing more, nothing less.

Don’t let it become a tool of control.

As deadly as a Fart

Sunday, September 20th, 2020

The truth is finally starting to leak out.

This article from The Telegraph echos what was reported by the BBC: https://news.yahoo.com/almost-one-third-covid-deaths-155426293.html

The Telegraph further exposes the blatant exaggeration and manipulation of Covid deaths reported in the UK.
In the same article:

“It means someone who suffered a heart attack, or even died in a road traffic accident,  may have been included in the figures if they had also tested positive for coronavirus at some point”

And another couple of insightful quotes:
“In the lockdown, there may have been even more deaths that were not caused by Covid, but were caused by the actions of lockdown – and that is important to know,” added Dr Oke.”

“Dr Jason Oke, part of the team from the Centre of Evidence-Based Medicine at Oxford that uncovered the data, said many people had been dying “with” coronavirus but not “from” it.”

Now we also have growing evidence that the reported number of infections is being exaggerated:
https://justthenews.com/politics-policy/coronavirus/growing-body-research-indicates-many-confirmed-covid-19-cases-might-not

“A growing body of research suggests that a significant number of confirmed COVID-19 infections in the U.S. — perhaps as many as 9 out of every 10 — may not be infectious at all
Also reported by the BBC here:  https://www.bbc.com/news/health-54000629

And for those that doubt the credentials of the above sources, some data from the US CDC:
https://www.cdc.gov/nchs/nvss/vsrr/covid_weekly/index.htm

With this interesting note:

So, only 6% of the deaths reported as due to Covid were directly attributable to Covid!
This is comparable to the UK estimate reported here:
https://www.bbc.com/news/health-53862413

where it is stated that 9 out of 10 deaths are due to underlying conditions.

Lets end this scam.

Scamdemic Real Numbers

Monday, August 31st, 2020

By now it must be quite obvious to anyone with more than half a brain that the Pandemic is nothing more than a scam.

Sadly the panic surrounding it has been fueled by the media and turned into a political and economic tool that is being abused throughout the world. Numbers are being inflated and manipulated to present a case that simply isn’t there.

Even the BBC, which has so often been at the forefront of scaremongering has admitted that around 90% of Covid-19 fatalities are actually due to underlying issues.

https://www.bbc.com/news/health-53862413

Taking an overly simplistic view that means instead of the 800000+ deaths reportedly due to Covid 19 there are actually around 80000.

And here lies the problem – when is a death a Covid death? This is quite a grey area. Currently any death that even remotely involves Covid 19 is being reported as caused solely by Covid-19.

Consider the case of a terminally ill 85 year old cancer patient with an estimated month to live.

Three weeks later they are diagnosed with C19, and die a week later. That death would be included as a Covid-19 death, when clearly it should not be.


As the BBC finally admitted, most deaths are occurring in those with underlying conditions – overwhelmingly obesity. It is no surprise then that we see America hit badly where 40% are classed as obese, and up to 70% overweight.

https://en.wikipedia.org/wiki/Obesity_in_the_United_States

The UK and other parts of the world that have been hit hard are not much different. Interestingly Mexico seems to be the only country taking notice.

https://news.yahoo.com/coca-cola-bottled-poison-mexico-110014920.html


So, is Covid the cause of these deaths? Not really.

Does it contribute? Possibly, but so would any seasonal flu!

Whilst it might seem harsh to say, these people would have died in the same time frame anyway.


So let’s put it all in some sort of perspective.

https://ourworldindata.org/causes-of-death

Heart disease is the leading cause of death worldwide, followed by cancer, but other common diseases kill also:

1.4 Million die each year from Hepatitis

https://www.who.int/campaigns/world-hepatitis-day/2019

1.5 Million died from Tuberculosis in 2018

https://www.who.int/tb/global-report-2019

800000 die from Suicide each year!

https://ourworldindata.org/suicide

Over 500000 die of diarrhoea

https://www.who.int/news-room/fact-sheets/detail/diarrhoeal-disease

In 2018, 140000 died from Measles!

https://www.who.int/news-room/detail/05-12-2019-more-than-140-000-die-from-measles-as-cases-surge-worldwide


And we are panicking over the seasonal flu!

What a sad world we have let it  become.


SMGLV – SeaMap GunLink Viewer

Thursday, July 30th, 2020

A while back I was sent some data files from Seamap’s GunLink system

http://www.seamap.com/products/seismic/gunlink/

It has been a long time since I have done any marine work, so I can’t comment on the system itself except to say that it looks very nice and quite capable.

Unfortunately, the way they decided to record data for offline QC is not so clever (IMNSHO). Instead of creating their own dedicated format that would have suited the job and the equipment, they decided to use SEGD. The problem being that their data does not easily fit into the SEGD format. SEGD is a bad enough format as it is without further abuse!

There are distinct sets of data with different sample rates and number of samples. Their solution was to use different channel sets for each set of data, which does make sense, but decoding gets messy. To complicate it further they (can and do) use a sample rate that is not supported by the SEGD format. Nor do they identify the origin of each channel set, so, unless there are exactly 5 channel sets, there is no telling what the data represents – Near field signature, Far field Signature, Hydrophones or something else.

That made writing a viewer for it interesting, but nothing is impossible.

The viewer provides for spectral analysis and first break picking of each channel set. The usual Gain, clip and colour settings are easily accessible.

The selected channel set’s data can be written to a SEGY file

And you can generate a PDF file of the current display, as well as copying images for use in reports.


More details and the download link here:

https://seismatters.com/SMGLV.html


The Scamdemic

Tuesday, July 28th, 2020

I have heard it called the Holocough, but that is disrespectful to those who suffered in the 1940s, so I prefer to call it the Scamdemic.

This must be the biggest scam ever perpetrated in human history.

That is not to say it is a conspiracy. I am not a conspiracy nut.

It is something quite natural – the seasonal flu – that was misreported and exaggerated and politicised. Then various groups saw an opportunity and started to exploit it to their advantage while deliberately fueling the lies and misinformation.

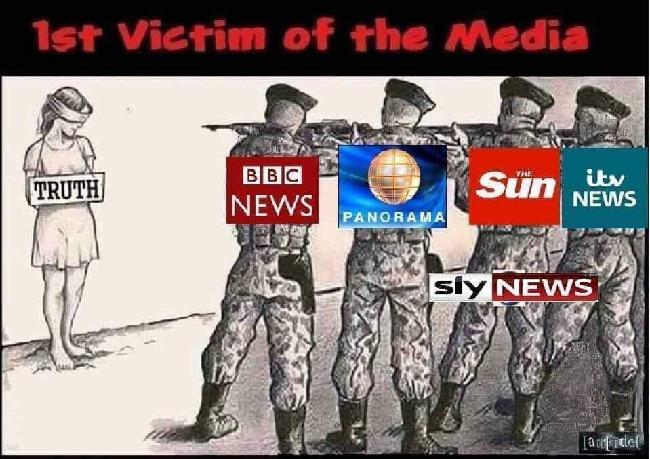
The media were the first of course, because, to paraphrase – the first victim of the media is truth.

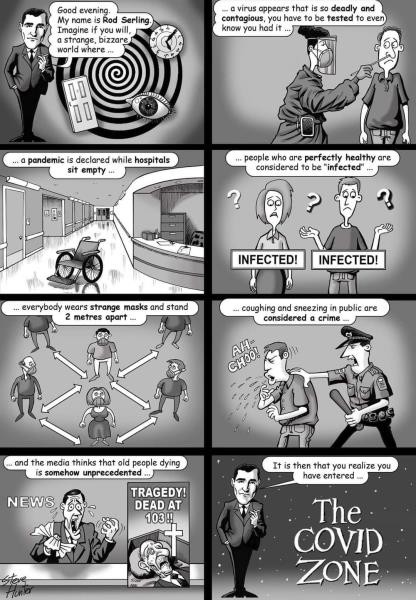
Quite well summed up here (from a parody site of course):

Then the bankers realised they could put many more people in debt while moving money around from government ‘stimulus’ packages that often propped up share prices of banks and their friends.

Then governments saw it as an easy way to get the migrant labour problem under control – force them out of work, blame them for spreading THE VIRUS then deport them while taking credit for DOING SOMETHING. Pity they didn’t control immigration in the first place.

The police saw it as opportunity to increase their ability to intimidate and detain.

And finally the security forces see it as a way to monitor and limit movement without any pushback.


The media, as usual are by far, the biggest part of the problem.

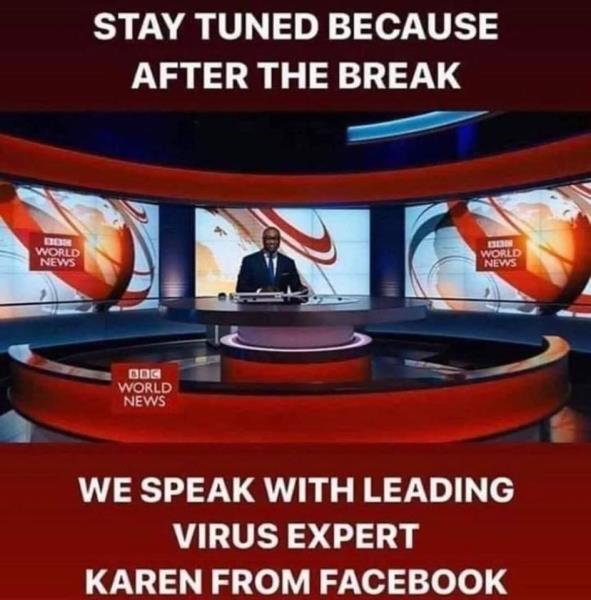
The Scamdemic allows “journalists” to sit around in comfort, drinking designer lattes while embellishing fake stories pulled from Facebook:

“David a fit and healthy 24 year old in training for the Olympics died in agony yesterday after being diagnosed with Covid-19 just 3 hours earlier. He leaves behind a young family of four. His wife tearfully said that she has lost her soulmate and does not know if she can carry on. (Please send lots of money)”

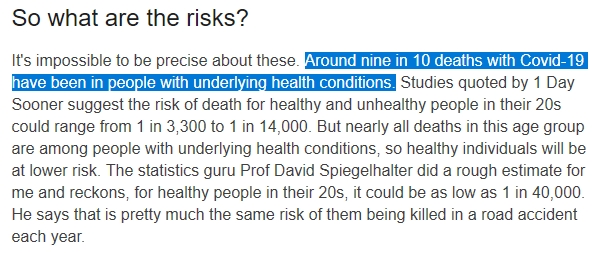
If David existed at all, we will find that he was a 400 pound blob, with diabetes, heart disease, asthma, AIDS and a boyfriend. It wasn’t Covid 19 the killed him, it was his life style choices.

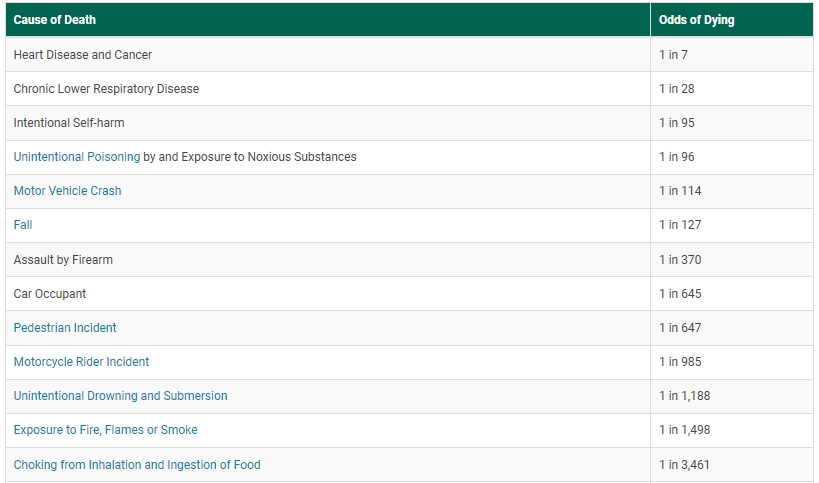
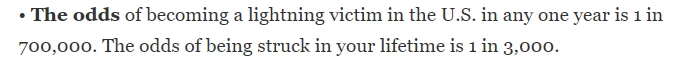
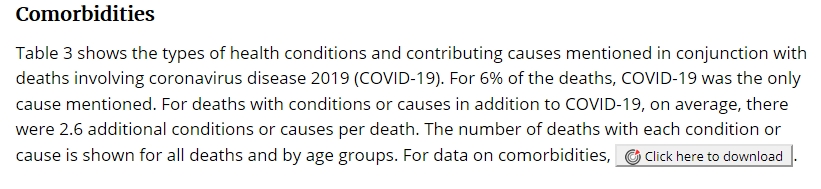
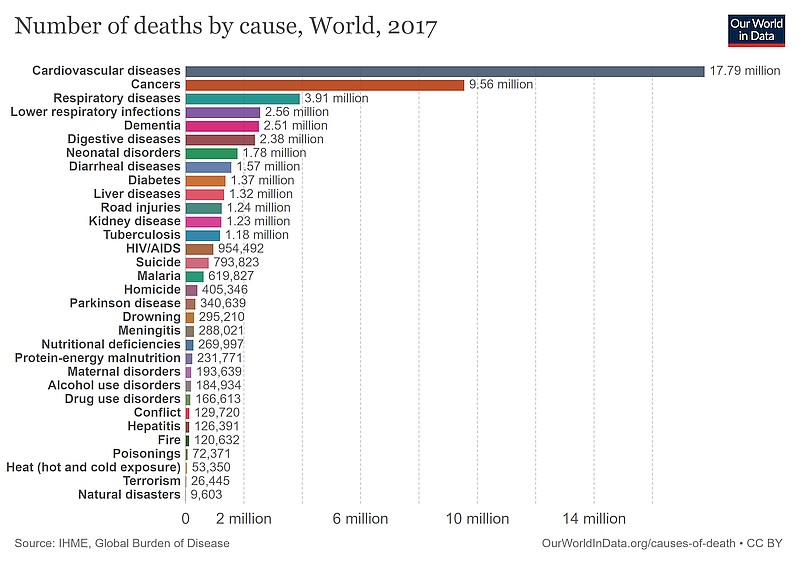
Actually, it does not take much research to find that the numbers just do not add up. In fact it is pretty easy to see that they are being manipulated to ‘prove’ to the gullible something that is not true.

Let’s look at how deaths are reported.

This quote from UK National Statistician Ian Diamond is interesting:

“He said the way Britain was counting and reporting its coronavirus-related deaths was the most transparent, because the ONS was including deaths where COVID-19 was mentioned on the death certificate even if the person had not been tested.”

Included as a Covid-19 death even if the person has not been tested!!! WTF? This is an open admission of lying!

And here the link

https://www.reuters.com/article/us-health-coronavirus-britain/uk-pushes-back-against-covid-19-death-toll-comparison-with-italy-idUSKBN22F0J6?feedType=RSS&feedName=topNews&utm_source=feedburner&utm_medium=feed&utm_campaign=Feed%3A+reuters%2FtopNews+%28News+%2F+US+%2F+Top+News%29

But…But…But… the quote no longer appears in the linked article. It was removed about a week after the article was first published. I wonder why.


Here another interesting piece of information, from May 2020, when we were supposedly in the midst of an exponential rise in infections. But researchers cannot find enough people to test!!

https://news.yahoo.com/oxford-scientists-working-coronavirus-vaccine-100847254.html

But are we not in the midst of a pandemic?? I am confused to say the least.


There are some voices of reason out there: Beda M Stadler, former Director of the University Institute of Immunology at the Insel Hospital in Bern:

https://medium.com/@vernunftundrichtigkeit/coronavirus-why-everyone-was-wrong-fce6db5ba809

The author has impeccable credentials and experience, but sadly bullied into silence.


There are lots more out there if you dig around a bit.

But the essence of it all is that the Scamdemic is now a political and economic tool, used by the bankers to get richer and various other groups to expand and abuse power.


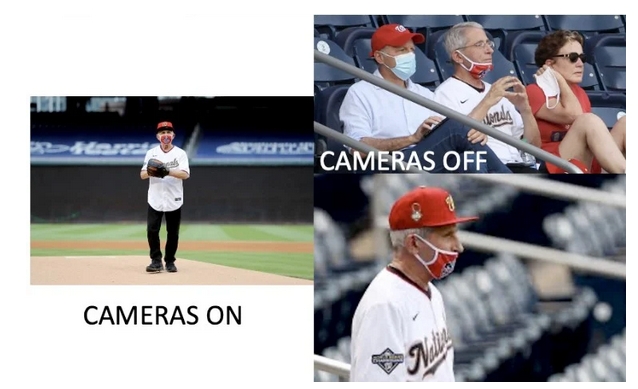
In the meantime what is the guy in charge of overseeing the response in the US doing:

https://www.cbssports.com/mlb/news/dr-anthony-fauci-throws-out-first-pitch-ahead-of-nationals-vs-yankees-on-mlb-opening-day/

I guess it must be really serious if the guy overseeing the response of what is supposedly a worldwide disaster can throw around softballs like an aspiring politician.


If you, like me want to see an end to this, take the advice given here:

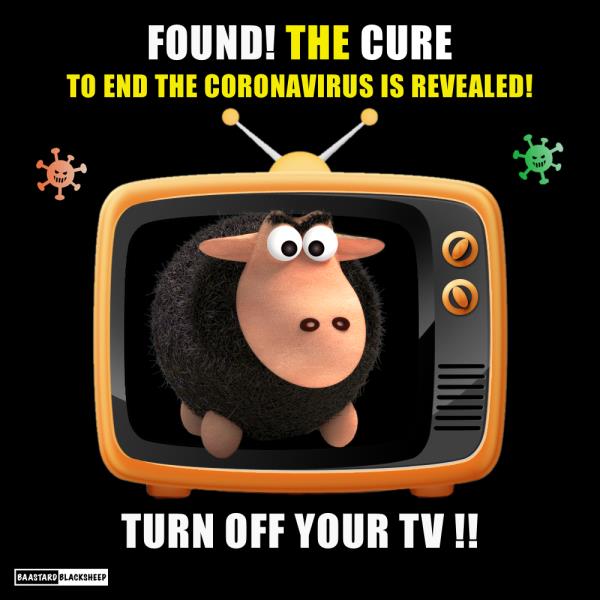
But don’t take my word for it. Do your own research. Just don’t blindly accept the lies that are being fed to you.


Still in Muscat.

Wednesday, May 27th, 2020

Over 6 weeks now and no sign of being able to get home any time soon.
My opinion has not changed. the response to this ‘pandemic’ has been nothing more than a panicked overreaction. It appears that it is following the normal course of all yearly flu’s, the only difference is that every infection or suspected infection is seized on by the media, feeding the panic. Minor Celebrities and politicians are getting in on it too. It seems to be quite fashionable for some of them to come down with with the virus and receive a lot of media attention that they would not have otherwise had.

Sadly the response is going to destroy far more lives than the virus.

It’s now nearly 5 weeks since the plate was put into my wrist.
I was hoping for more of a Terminator look, with the ability to rip apart people that annoy me, but this will do:

Still some stiffness, and full movement hasn’t returned yet, but it is markedly better than before the surgery.

I am getting quite bored here, I was at the stage of reading books twice, but then I decided to give eBooks a try, as getting conventional books in Muscat is difficult, especially with the restrictions in place. Started out reading on my Huawei tablet, and that was OK, but too heavy for reading at night in bed.
So got a Kindle Paperwhite.
Quite pleased with it, it is very light and the text clarity is great.
It’s user interface takes a bit of getting used to, but is manageable.
So at least I can have something to read.

Now just waiting for a flight.

Stuck in Muscat with a broken hand

Tuesday, April 28th, 2020

Currently typing with one hand only. I tripped and fell a few weeks ago and hurt my right hand. Thought it was just a bad sprain for a while, but had it checked when got back to Muscat.
It turned out to be well messed up, requiring surgery and the insertion of  a metal plate. Had the surgery done last Thursday at the Khawlah Hospital, which was just known as the PDO clinic when I first worked here in th 80s, if it had even been built then! It is a huge place now.
Two days in hospital, good professional treatment, great staff. Highly recommended for anyone in need of treatment.

The problem I have now is getting home.
Thailand has extended their lock-down until the end of May, and I have no news on when Oman will open up for departures.

I have to confess that I am a bit of a skeptic when it comes to this ‘pandemic’
If it had happened 40 or even 30 years ago, it would have been written off as just a bad flu season.
The problem we have now is that media, both mainstream and social, conflate real evidence with hypothetical possibilities. It is hypothetically possible that COVID-19 will kill billions, but the evidence clearly shows most people have little, if anything to worry about.
In fact the evidence clearly shows that the vast majority of those infected recover without intervention.
The media however want sensational headlines, and are happy to use any source to create them.

This from a parody site of course, but it does demonstrate what I mean.
There was a time when the BBC was a reliable source of unbiased news, now much of their content seems to be poorly researched, uninformed opinion pieces presented as fact.

Maybe I will get one of these:

I won’t even start on the American news outlets.

Furthermore, we have a distortion in the way things are counted from one year to the next.
What was the true number of flu deaths last year? No one knows, but we will surely know this year’s tally of COVID-19 deaths.

It will be years before we know the true story, if ever, but consulting the font of all knowledge – Wikipedia ……

https://en.wikipedia.org/wiki/Influenza#Epidemiology

(scroll down to about the middle to see the table “Major modern influenza pandemics”)
we see that in a typical yearly flu season the total worldwide deaths is anywhere between 290K and 650k, with over one billion infected.
Today, the worldwide reported count of infections for COVID-19 is just over 3 Million – after 4 months.
But what is the true count of infections? 2 Times? 10 Times? 100 times? More? We will likely never know, but it would not be unreasonable to assume a similar number to past flu seasons. Most of these unreported cases have recovered!

Yes, it’s a bad year, and yes we need to take care, but we should not be panicking.
And a lot of things forced on us now would have been unnecessary if common sense had prevailed years ago.

  • Why are (were?) obviously sick people allowed on planes/trains/buses? We have all been forced to sit next to them – why?.
  • Why do obviously sick people come into work? We have all had to work near them – Why?

Common sense should have stopped this years ago, and it would now be normal practice worldwide for anyone with flu like symptoms to self isolate.

As I see it, this variant has to run its course the same as every year.
Maybe some good will come of it with work towards a cure or effective vaccine for all flus.
hopefully we will see less people with flu symptoms out and about spreading their disease.

Agree with me or not, as you like, but don’t just accept what is being fed to you by the media.
I will of course comply with the rules.
But I will remain a skeptic.

SMSim3 Available

Sunday, February 16th, 2020

SMSim3 is now ready.
It is easy to use, quite configurable and can produce ‘report grade’ graphics.

It handles a variety of file formats:

  • SEGD Versions 2 and 3
  • SEGY IBM and IEEE floating point
  • Sercel Ground Force files
  • Verif-i VFI files from their Sandwich box tester *(Limited- see manual)

You can produce the usual sim displays, plus a lot more –

  • Comparison displays
  • Mass-BP plot
  • Tapers and envelopes
  • Distortion analysis

There is a camera function to select and display only the traces you want

A unique feature for added QC is Stored Pilots.
You can even convert Custom sweeps from Sercel format to VibPro format and vice versa

Details Here:
https://seismatters.com/SMSim3.html

SMRefract and broken pins

Saturday, February 8th, 2020

On a recent job, I noticed traces going dead during the day for no apparent reason.
Although it is not uncommon to see the occasional intermittent trace, this was occurring too often for my liking.

Luckily, SMRefract includes a database facility that can provide a history of bad stations.
What I saw was traces that were repeatedly intermittent.
A bit of investigation in the field revealed that FDU pins were breaking off inside the molding. It usually wasn’t obvious until the pin was actually wiggled, although in some cases the pin would pull
out when the geophone string was disconnected.
Even more entertaining was that some of the troubleshooters were well aware of the problem and instead of changing the link, would insert a piece of wire or solder into the female pin of the geophone string to ‘fix’ the station.

Quite a creative idea, but it just meant that bad equipment rolled to the front, requiring it to be fixed again in the future. It also meant that geophone strings with a blocked female pin would (attempt to) be connected to good FDUs, likely damaging them too.

I found that using SMRefract to detect these stations was practical, but a bit tedious, so have made some major changes in the Database dialog. There is now an ‘Output List’ where you can add traces you want to look at, and you can output Garmin or KML files that can be directly uploaded to a GPS if you want to go look at them.

Another new feature added is that FDUs that fail for the same fault at different locations can now be listed.
This enhances the ability to detect the FDUs with broken pins, and it will also allow you to detect FDUs that repeatedly fail tilt/leakage/resistance inexplicably and FDUs that perhaps show up as noisy more often than they should. Furthermore it allows you to see if bad equipment has in fact been removed from the line.

Here we see an FDU that had been checked and found to be bad (by me) and the recorder notified

And here the same FDU failing for the same fault a few weeks later at the front, meaning it was not changed when I asked.


Details of changes will in the manual in a few days.


Downgrading to Windows 10

Monday, February 3rd, 2020

With the end of support for Windows 7, I reluctantly decided to try out Windows 10.
The ‘upgrade’ went very well, although it took several hours.
The problem then was to make it usable.
Perhaps the underlying code-base of W10 is more stable and secure (maybe). To be honest I don’t care – Windows 7 proved
itself to be more than capable in both regards. I just want a system that is usable.
Sadly, it is quite obvious that Microsoft let the 5 year olds loose with the visual aspect of Windows 10.

The first thing to do of course was to turn off Cortana, the Aero crap and Microsoft telemetry.
Then try to adjust the visual appearance.
Windows 10 pretends to allow for customisation, but you cannot turn off themes. Themes are probably the single worst feature that Microsoft has ever come up with.
It appeals to managers, accountants and 15 year old school girls, but is a major source of frustration to anyone who actually needs to use a Windows computer for work.
You cannot individually set colours for the various parts of a dialog (title bar etc) or for the desktop, without affecting other parts – it is called the ‘Accent Color’ for some unknowable reason.
To make it even worse, the dialog windows now do not have any visible edge and the Title bar has been made far too large.

There is some good news though, there are 3rd party tools that can improve the visual aspects of Windows 10 but they do not entirely cure it. The user interface is simply terrible, to the point of being barely usable.
It is no real surprise that many people are now seriously considering a move to Linux.

Something that came as a further unpleasant surprise to me was that some of my QC software would not work under Windows 10.
Most of this was my fault – I even had comments in the code along the lines of “maybe a problem here, should check return value”
Once I fixed these oversights, things worked.
And it motivated me to add some features and fix a few niggling issues, more in another post in a few days.
So SMRefract, VAPSDB3, PN2 and SMSim3 now all work well under Windows 7 and 10.

For anyone considering a downgrade to Windows 10, you need:

http://www.classicshell.net/
to give you a usable start menu – the W10 one is unusable

https://www.oo-software.com/en/shutup10
to disable a bunch of Microsoft spying and useless shit

https://msfn.org/board/topic/170375-oldnewexplorer-119/
This removes the ribbon bar crap from file explorer and makes it work better

Then you can spend a few hours trying to get a colour scheme that is barely usable, because that is the best that is possible.
Until you install this one:

https://winaero.com/comment.php?comment.news.1836

And enable the ‘Aero Light’ Theme, which is apparently deliberately hidden to prevent users from having a usable machine.
With it, you can get a just acceptable visual interface.
Sadly, we don’t have much choice anymore, Windows 10 is here to stay, or until Microsoft decide to screw us over again.

If only ReactOS had the support it needs to be completed:
https://reactos.org/

Another belated update

Friday, November 8th, 2019

A bit of a slow period lately.

A bit more work on VAPSDB3, it can now produce a surface velocity map. It is experimental at this stage and will require validation, but the results look believable. Of course this is only one piece of the puzzle, we also need the depth that corresponds to the calculated velocity. I can probably derive that by analysis of GF data. I did some work on that a few years ago.

Just need some data and some time and some motivation.

I also wrote some experimental software to convert INOVA VibPro VM files to the VAPS format so they can be loaded into VAPSDB3.

The VM files have some shortcomings, not the least being documentation, but the code seems to work. I guess I will refine it if I ever end up on a VibPro crew again.

The plan now is to get back to SMSim3 and maybe start on a new version of SLX.

VAPSDB3 Fleet QC

Saturday, October 5th, 2019

After a brief trip to Oman a couple of months ago for a startup, I have had time to work on VAPSDB3.

It now outputs KML Overlays – these are images that get overlayed in the appropriate place on Google Earth.

Although I don’t think Google Earth is the most appropriate thing for QC support (even if your crew has a decent internet connection, you really need a proper GIS package and up to date imagery), it can be useful to send overlay files to demonstrate a point or an issue.

I have also added a “Fleet QC” section.

This is something I have been thinking on for a long, long time.

The original concept of VAPSDB was analysis if Vib attributes at the sweep level.

But despite the current drive towards single vib source, many crews still operate with fleets of 2, 3, 4 or more vibs.

Hence Fleet QC.

Of course, adding this means I will have to add VP QC for the obvious case of more than one sweep per VP.

But one thing at a time.


Fleet QC at first glance looks much like the Areal display of single vib attributes.

But it does quite a bit more.

You can set up “Reshoot Criteria” where a Sweep will be flagged for reshoot if the criteria are met – for example, the average Force level for the VP is out of spec, or any vib in the fleet has a GPS fault flagged.

Probably the most useful feature is the numeric listing of “Reshoot Required” which will also display if and when a bad point has been reshot.

Double clicking on an entry will let you see exactly what was going on with the fleet at that point

Fleet QC can also output KML Polygons (blocks) to provide a sort of 3D view of things.

But be aware that if outputting too many points, Google Earth may choke.

It is more of a display to distract junior managers than for anything serious.

The plan now, other than looking for work is to get back to SMSim3.

SMSim3

Thursday, May 23rd, 2019

SMSim3 is almost finished.
Just need to do some cosmetic tidy ups and resolve a few minor details.
Then I just need some work so I can try it out.

It outputs the usual basic sim display, plus Mass/BP plots, Pilot/Ref QC plots, Amplitude Envelopes, Taper QC, Distortion analysis.
There is a ‘Camera’ page that allows you to display traces of your choice.
Colours and Fonts can be changed to suit your display wants and needs.
Data can be in one or many files, depending on how you record sims.
It handles Sercel and VibPro controllers and can read a variety of data formats.

Some displays below.

SMCSX

Sunday, April 14th, 2019

With SMCSX you can see what your custom sweeps really look like.

It handles Sercel Custom files and INOVA’s SCI format.

Very easy to use, and the displays are quite customisable.

Details here:

https://seismatters.com/SMCSX.html


FWIW, this and the ability to convert between INOVA and Sercel formats is built into the soon to be released SMSIM3.


SMPanels Update

Tuesday, August 21st, 2018

Added printing and Multi Image export

The user manual is available here:
www.seismatters.com/SMPanels/SMPanels%20User%20Manual.pdf

Example Print Output:

SMPanels

Sunday, August 12th, 2018

Anyone who has been involved with parameter tests will be familiar with the concept of Display Panels.
Considering the importance of these in parameter selection, it can be a frustrating exercise, especially if the tests involve different systems, receivers or sample rates

SMPanels allows you to generate panels in the field.
It handles SEGD data from:

  • Sercel – 388, 408, 428, 508, Seal, Unite, WTU and DSD464 GF files
  • Geospace – GSR, GCL, GSB
  • Innoseis
  • SmartSolo
  • Along with SEGY, SEG2 and Verif-i Sandwich Box

Setup is fairly easy – put all your files into a folder of your choice, direct the program there,
select which files you want to analyse, along with the analysis window and go.

A post scalar can be applied to each selection if desired to adjust the perceived gain for a particular test.
This is very useful in the case of different recording systems, or different receiver arrays.

Filters can be applied, gain and colours adjusted.
Results can be output to a file, or to clipboard for pasting into reports.

More information here: SMPanels


SMGetDSD

Wednesday, June 27th, 2018

One that I have been asked for many times over the years is a program to check the GetDSD files that are available from Sercel’s VE432 and 464.

So, here it is.

More Details here:

http://seismatters.com/SMGetDSD.html

And User Manual here:

http://seismatters.com/SMGetDSD/SMGetDSD%20User%20Manual.pdf

Quick and easy identification of Errors or out of tolerance conditions

Graphs of measured parameters